




- Published on: 2026-11-02 10:39:52
Annualizing Trading Returns: Compare CAGR and Total Return

A strong total return can hide a much slower yearly pace. Annualizing trading returns converts a holding-period gain or loss into a compound annual rate: (ending value ÷ starting value)^(1 ÷ years) − 1. A 30% gain over three years, for example, equals about 9.14% annualized, not 10% each year.
Total return still matters: it shows the full change over the holding period, including income such as dividends or interest. But it does not show how quickly the result accumulated, and a simple arithmetic average can misrepresent the effect of compounding. The right comparison also depends on the period measured and whether deposits or withdrawals changed the account balance.
This guide explains CAGR, compares it with arithmetic averages and total return, and shows how to interpret monthly, quarterly, and shorter-period figures without mistaking a brief run for a lasting pace. It also explains why cash flows complicate performance comparisons and which return measure best answers your question. Use a consistent basis to distinguish investment growth from money added to or withdrawn from the account.
Key Takeaways
- Use CAGR to compare compounded growth across different holding periods, while keeping the length of each period in view.
- Distinguish the arithmetic average of periodic returns from the compounded result your investment actually experienced.
- Annualize short-period returns carefully: a converted rate describes a pace, not a promise that it will continue.
- Separate investment performance from deposits and withdrawals, which can change an account’s ending balance without reflecting trading gains.
- Choose total return to understand the full-period result, and annualized return to assess its yearly pace.
What is Annualized Return (CAGR)?
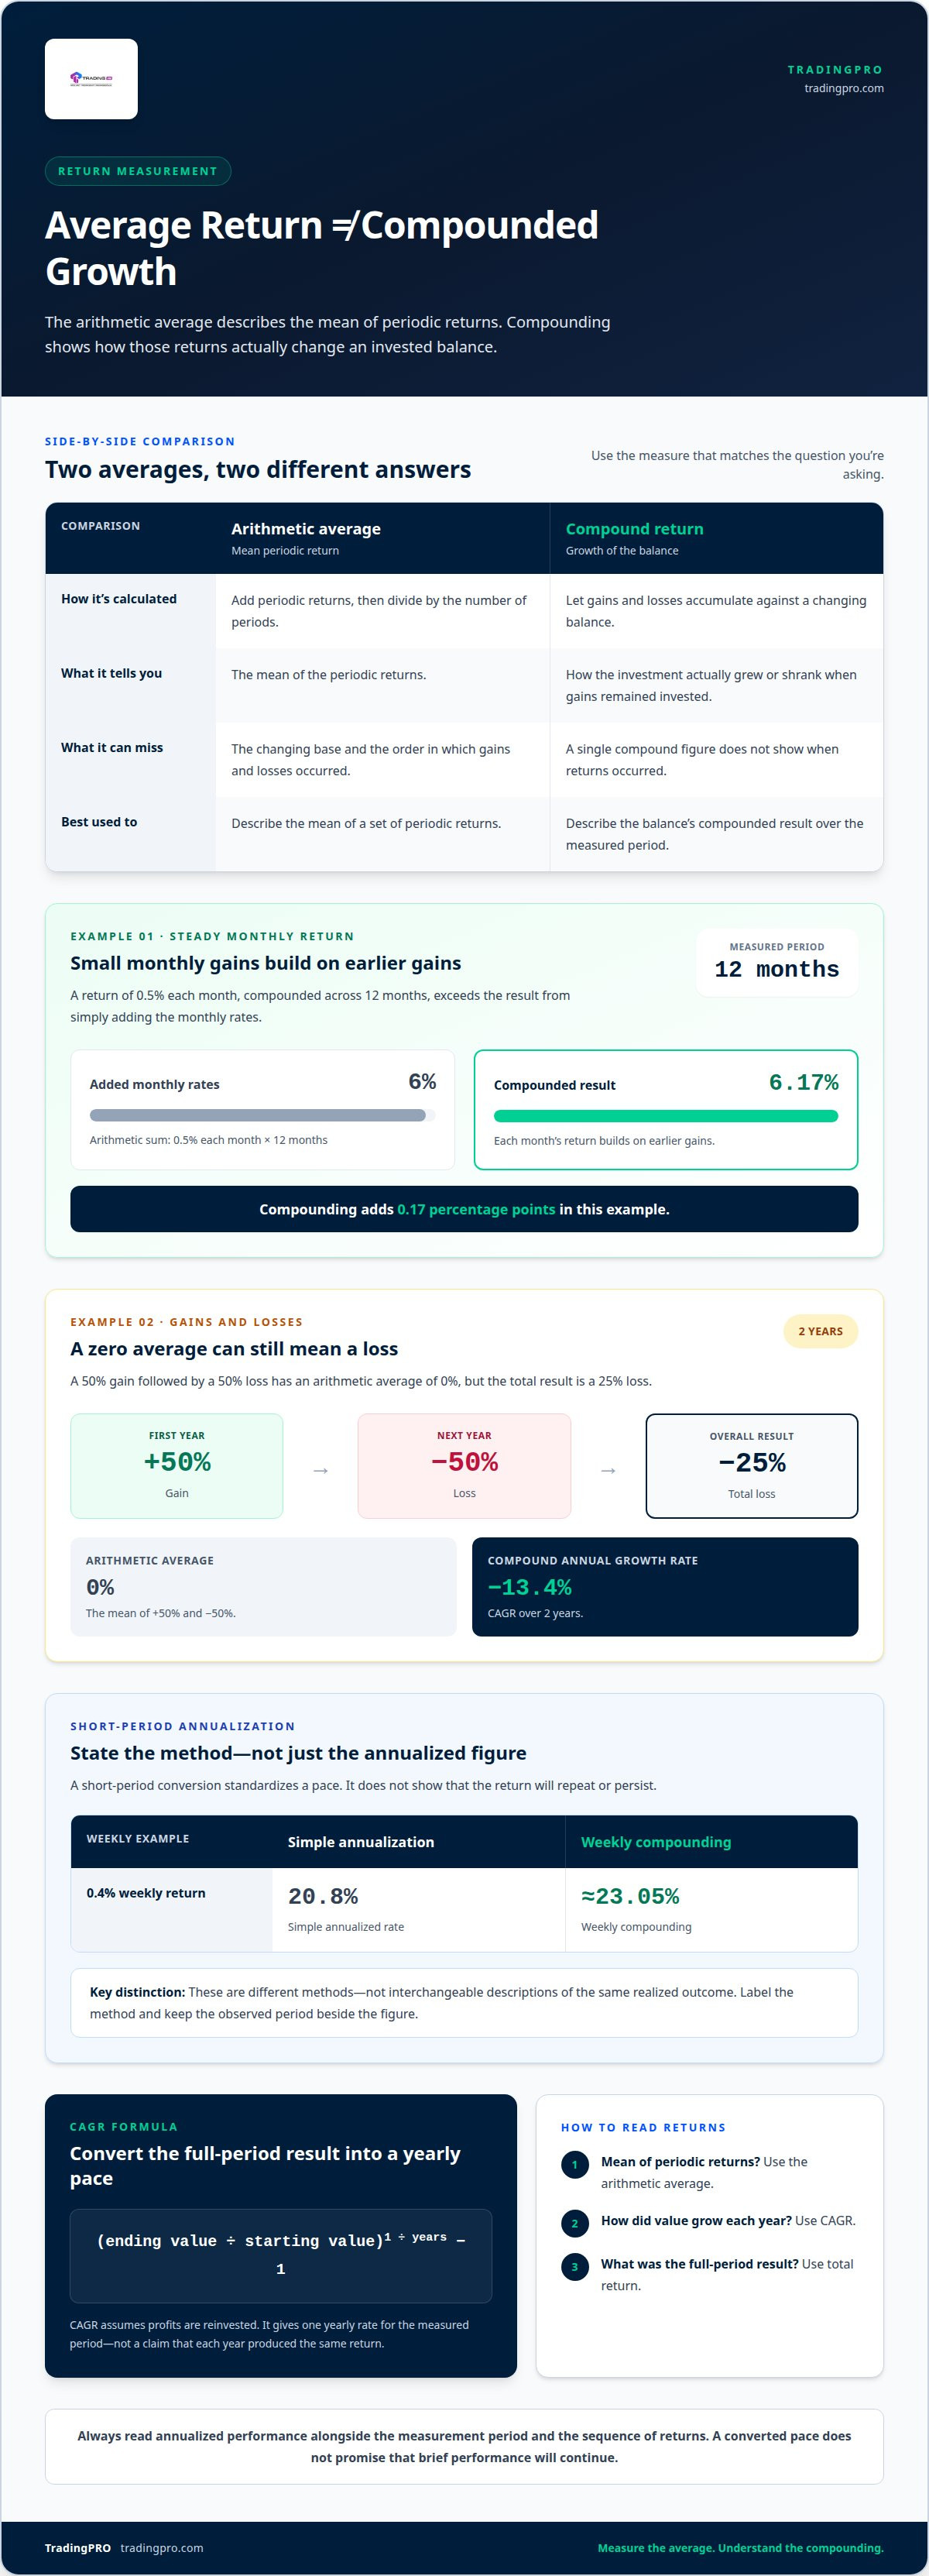
Annualized return expresses an investment’s compounded growth as a yearly rate. Calculate it by dividing the ending value by the starting value, raising that result to the power of one divided by the number of years, then subtracting one. In formula form: CAGR = (ending value ÷ starting value)^(1 ÷ years) − 1. The method assumes profits are reinvested. It gives one yearly rate for a particular period, not a claim that each year produced the same actual return.
Use CAGR to compare investments held for different lengths of time. An investment that grows from $5,000 to $12,000 over six years has an annualized return of 15.7%. That figure puts its growth on a yearly basis, making it easier to compare with another investment’s annualized result. But check the periods behind both figures. A longer period includes more market movement, while a short period may reflect only a narrow market phase. Matching the calculation method improves the comparison, but doesn’t make the investments equally risky.
For periods shorter than a year, express the holding period as a fraction of a year before applying the formula. A 45-day holding period is approximately 0.1233 years using 45 divided by 365. A six-month holding period return of 16.9% annualizes to 36.6% when compounded over a 12-month scale. That conversion makes the pace comparable with an annual result. It doesn’t mean the return continued at that pace for a full year. A brief period can produce a striking annualized figure without showing how performance changes across longer periods.
Annualized performance and aggregated results answer different questions. The total return shows the full gain or loss between starting and ending values. CAGR translates that total into a compounded yearly rate. For example, an 8% gain over one year is also an 8% annualized return. Over multiple years, the same total gain would imply a different yearly pace. Compare CAGR when the question is “How quickly did value grow each year?” Use total return when the question concerns the complete result across the holding period.
To compare annualized investment performance, align the start and end dates, use the same definition of returns, and account for the length of each period. Then read CAGR alongside the actual total return. A single annualized number cannot show when gains or losses occurred. An investment could lose 40% and later recover, yet its long-period annualized result wouldn’t reveal the size or timing of that decline. Annualizing trading returns helps standardize growth rates, while the underlying period-by-period figures show the path that produced them.
Arithmetic average versus compound return
The arithmetic average adds periodic returns and divides by the number of periods. The compound result shows how returns changed the starting balance as gains and losses accumulated.
Compounding Reinvested Gains
Compounding occurs when gains remain invested and contribute to later returns. This matters because each period’s gain or loss applies to a changing balance, not the original amount.
Consider a return of 0.5% each month. Compounded across 12 months, it produces about 6.17%, rather than the 6% found by adding the monthly rates. That difference comes from returns building on earlier gains. Reinvesting gains therefore changes the actual result, even when each monthly rate appears small.
Volatility makes the gap between an arithmetic average and compound growth more visible. If an investment gains 50% in one year and loses 50% the next, its arithmetic average is 0%. The total loss is 25%, equivalent to a CAGR of -13.4% over two years. The arithmetic metric hides the change in the investment’s base.
Use the arithmetic average to describe the mean of periodic returns, and the compound return to show how a balance actually grew or shrank. For a historical comparison, review both the average and the sequence of returns. The same mean can produce different ending values when gains and losses occur in a different order.
Mistakes in Short-Term Annualization
A common mistake is multiplying a short-period return by the number of periods in a year and treating the estimate as compounded growth. Another is assuming a brief result will repeat unchanged. Annualizing trading returns standardizes the pace, but does not show whether the performance will persist.
For example, a 0.4% weekly return becomes 20.8% through simple annualization, while weekly compounding gives about 23.05%. Those are different methods, not interchangeable descriptions of the same realized outcome. State which method you used and how long the observed period lasted.
A 3% gain in one month can also produce a large annualized figure, but the conversion doesn’t establish that the gain is repeatable. Likewise, a monthly rate multiplied by 12 is a simple annual rate, not a compounded annual return. If the question is how a balance would grow with reinvested gains, use the compound method; if you’re reporting a basic rate conversion, label it clearly as simple.
Keep the measurement period beside every annualized figure. When reviewing Social Trading / Copy Trading results, distinguish the arithmetic average from compounded performance before interpreting the record. You can create a TradingPRO account to explore the offering and apply these distinctions to return comparisons.
Annualizing monthly, quarterly, and daily returns
For irregular periods, calculate CAGR using elapsed time as a fraction of a year: (ending value ÷ starting value)^(1 ÷ years) − 1. Daily annualization commonly uses 252 trading days per year; monthly, quarterly, and weekly conversions use 12, 4, and 52 periods.
Aggregating Monthly Returns
Grouping monthly returns by calendar year shows each year’s compounded result and helps compare yearly performance. For each year, multiply the monthly gross returns, such as 1 plus each monthly rate, then subtract 1.
Keep that yearly result separate from the average monthly rate. For instance, averaging 12 monthly percentages and multiplying by 12 gives a simple annualized mean, not the compounded return from those months. The distinction matters when monthly results vary. A 0.21% monthly rate and a 0.29% rate differ by 0.08 percentage points; multiplying that difference by 12 gives 0.96 percentage points, a rate comparison rather than an account’s yearly growth.
For monthly returns, use 12 periods per year. A 1.5% monthly return annualizes to about 19.6% if that return is assumed to persist and compound for 12 months. Simple annualization would multiply the monthly percentage by 12, producing 18%. Label the method clearly: the compound calculation projects repeated reinvestment, while the simple calculation scales the rate without compounding.
Irregular Trading Periods
For an irregular holding period, use the actual elapsed time rather than treating it as a full month or quarter. Convert the period into years, then apply the annualized-return formula to the starting and ending values.
Day-count conventions can use 365 days, 365.25 days, or actual calendar dates. Choose one basis and apply it consistently when comparing results. For daily returns, 252 trading days per year is a common annualization basis; it differs from calendar-day counting because markets don’t trade every day.
Quarterly returns use 4 periods per year. A quarterly growth rate of 0.8%, compounded across four quarters, corresponds to 3.24% annualized. Weekly returns use 52 periods per year, while a daily rate is compounded across the chosen trading-day basis. These conversions let you compare different reporting intervals, but the period and method must accompany the percentage.
A monthly mean and a yearly compounded result answer different questions. The mean summarizes the typical monthly percentage; compounding reflects the balance after successive gains and losses. For performance reporting, calculate each calendar year from its actual monthly returns, then compare the yearly results. This avoids mistaking a monthly average for the account’s realized annual growth.
Cash flows and investment performance
A portfolio’s ending balance combines investment performance with money added or withdrawn. Separate external cash flows from price appreciation, dividends, and interest before interpreting an annualized result. For example, a portfolio starts at $10,000, receives a $5,000 deposit, and ends at $15,500. The balance rose by 55% relative to its starting value, but that figure doesn’t mean trading generated a 55% return. The deposit contributed to the ending balance.
Time-weighted returns help compare investment performance by measuring returns across subperiods and neutralizing the effect of deposit or withdrawal timing. Money-weighted returns account for when and how much cash entered or left. Use the first to compare an investment strategy across periods, and the second to understand how cash-flow timing shaped an investor’s experience. The right metric depends on whether you’re evaluating the strategy or the portfolio owner’s actual result.
Cash-flow timing affects the annualized calculation because each deposit has its own time in the market. A contribution made near the start of a measurement period affects performance differently from one added near the end. Apply one consistent method across the full period, and record the date of each deposit and withdrawal. This helps distinguish contributed capital from investment appreciation.
Risk belongs beside return. Monthly volatility of 4.5% annualizes to 15.6% using the square-root-of-12 rule. This volatility figure describes variability, not a forecast of losses or gains. To annualize a Sharpe ratio calculated from monthly excess returns, multiply it by the square root of 12, using the same return frequency and annualization basis. A Sharpe ratio compares excess return with volatility, so it adds risk context rather than replacing a return measure.
Past performance needs context. An annualized figure condenses a sequence of results into one rate, but does not show when losses occurred or how much risk the portfolio carried. Compare the rate with the underlying periods, drawdowns, and cash-flow dates. When monthly returns vary, the timing and size of deposits can shape the owner’s outcome even if the investment’s time-weighted record is unchanged.
Investment goals determine the relevant time horizon. A portfolio intended for a near-term expense calls for a different evaluation period than one built for long-term growth. Inflation also changes what a nominal rate represents: a portfolio with a 10% nominal CAGR and 3% average inflation has an approximate real CAGR of 6.8%. Compare nominal return with inflation-adjusted growth to understand how much purchasing power the investment’s appreciation represents.
Annualized return versus total return
Total return measures the complete gain or loss across a holding period. Annualized return expresses that result as a compounded yearly pace. These figures answer different questions: total return shows what happened to the investment overall, while annualized return helps compare growth rates across periods. Neither replaces the other. For an accurate comparison, identify the holding period and confirm whether income, such as dividends or interest, is included.
Calculate total return by combining price appreciation with income, then comparing that amount with the starting value. For example, an investment grows from $10,000 to $12,000 in one year and pays $400 in dividends. This example shows the effect of dividends. Looking only at the change in investment value would miss part of the return.
The S&P 500 Total Return Index example makes the distinction clear across a longer period. An investment of $10,000 on January 1, 2018, reaches $15,690 on December 31, 2022. That represents a 56.90% total holding-period return and an approximate 9.43% CAGR from 2018 through 2022. The total return records cumulative growth; CAGR converts that growth into a yearly rate for comparison.
An annualized rate can conceal the path between those dates. In the same S&P 500 Total Return Index example, the approximate annual return was 31.49% in 2019 and -18.11% in 2022. A single CAGR doesn’t show those yearly swings, their timing, or the size of interim losses. Review annualized performance alongside total return and individual period results to understand both the final outcome and how the investment got there.
Choose the measure that fits your decision. Use total return to assess the complete result over a specific holding period, including appreciation and dividends or interest. Use annualized return to compare results measured over different lengths of time. Keep the start and end dates consistent, and compare like with like. Fees, expenses, and taxes affect realized performance, so a figure that excludes them will differ from the investor’s net result.
Both measures have limitations: total return doesn’t standardize time, and CAGR doesn’t reveal volatility or the sequence of gains and losses. For example, the S&P 500 figures show why a 9.43% annualized rate needs the 56.90% cumulative result and yearly context beside it. Read all three views together before judging performance. To explore Social Trading / Copy Trading while applying these comparisons, register with TradingPRO.
TradingPRO: Rookie Account
TradingPRO’s Rookie Account is an option for readers ready to put their understanding of returns into practice. Use the comparison methods in this guide to review performance over consistent periods, distinguish total return from annualized growth, and account for deposits or withdrawals when assessing results. Clear records help you understand what your figures measure, but they do not remove market risk or make past performance a guide to future outcomes.
If you’re exploring trading, start with a clear view of your goals and how you’ll evaluate results. Visit TradingPRO’s Rookie Account page to learn more.
Turn Return Analysis Into Your Next Move
Make performance measurement part of your trading routine. Keep a record of results, cash flows, and the period each figure covers, then choose the measure that fits the decision in front of you. This gives you a stronger basis for reviewing a strategy and refining your approach. Annualizing trading returns can support that process, but disciplined interpretation matters as much as the calculation.
TradingPRO offers Micro and Pro Accounts alongside its Rookie Account. Consider which account aligns with your trading approach, and use clear performance measures to guide your evaluation. Take the next step when you’re ready: explore your TradingPRO account options.
Build your process carefully, learn from each review, and keep moving forward with purpose.
Frequently Asked Questions
How do you annualize a trading return?
Divide the ending account value by the starting value, raise the result to the power of one divided by the holding period in years, then subtract one. For a period shorter than a year, express elapsed time as a fraction of a year. Include trading income and losses consistently in both values. If the ending value is below the starting value, the formula returns a negative annualized rate.
What is the annualized return formula for daily, weekly, and monthly returns?
For a repeating periodic return r, use (1 + r)^n − 1, where n is the periods per year: 252 for daily trading returns, 52 for weekly, or 12 for monthly. For example, enter a daily return as a decimal and raise its gross return to the 252nd power. These conversions assume the period’s rate repeats; they don’t describe the actual sequence of future trades.
How do you annualize compound returns versus simple returns?
Simple annualization scales a periodic return by the number of periods in a year: a monthly rate is multiplied by 12. Compound annualization raises one plus that rate to the 12th power, then subtracts one. Use simple scaling to state a linearized rate, and compounding to model reinvestment at the same rate each period. Label the method, since identical monthly inputs produce different annualized figures.
How do fees, taxes, and deposits or withdrawals affect annualized trading returns?
Fees and taxes reduce the investor’s net result, so a return calculated before those costs differs from an after-cost return. State whether the figure is gross or net. Deposits and withdrawals change account value independently of trading gains. For example, adding capital midway through a period can increase the ending balance without improving the strategy’s performance. Time-weighted returns isolate strategy results; money-weighted returns reflect cash-flow timing.
How does annualized return differ from CAGR and average annual return?
Annualized return and CAGR commonly refer to the same compounded yearly growth rate over a defined period. “Average annual return” can mean that rate, but it can also mean the arithmetic average of yearly returns. Check how the figure was calculated. An arithmetic average gives each year equal weight; CAGR reflects the effect of successive gains and losses on the investment balance.
How should annualized returns be compared with a benchmark or buy-and-hold investment?
Match the measurement dates and return method before comparing a strategy with a benchmark or buy-and-hold result. Include dividends or interest consistently, and compare figures in the same currency and on the same gross-or-net basis. If deposits or withdrawals occurred, use a method that treats cash flows consistently for both results. Then review volatility and interim losses alongside annualized performance, not just the final rate.


